
Congressional Research Service
data visualizations & Annual report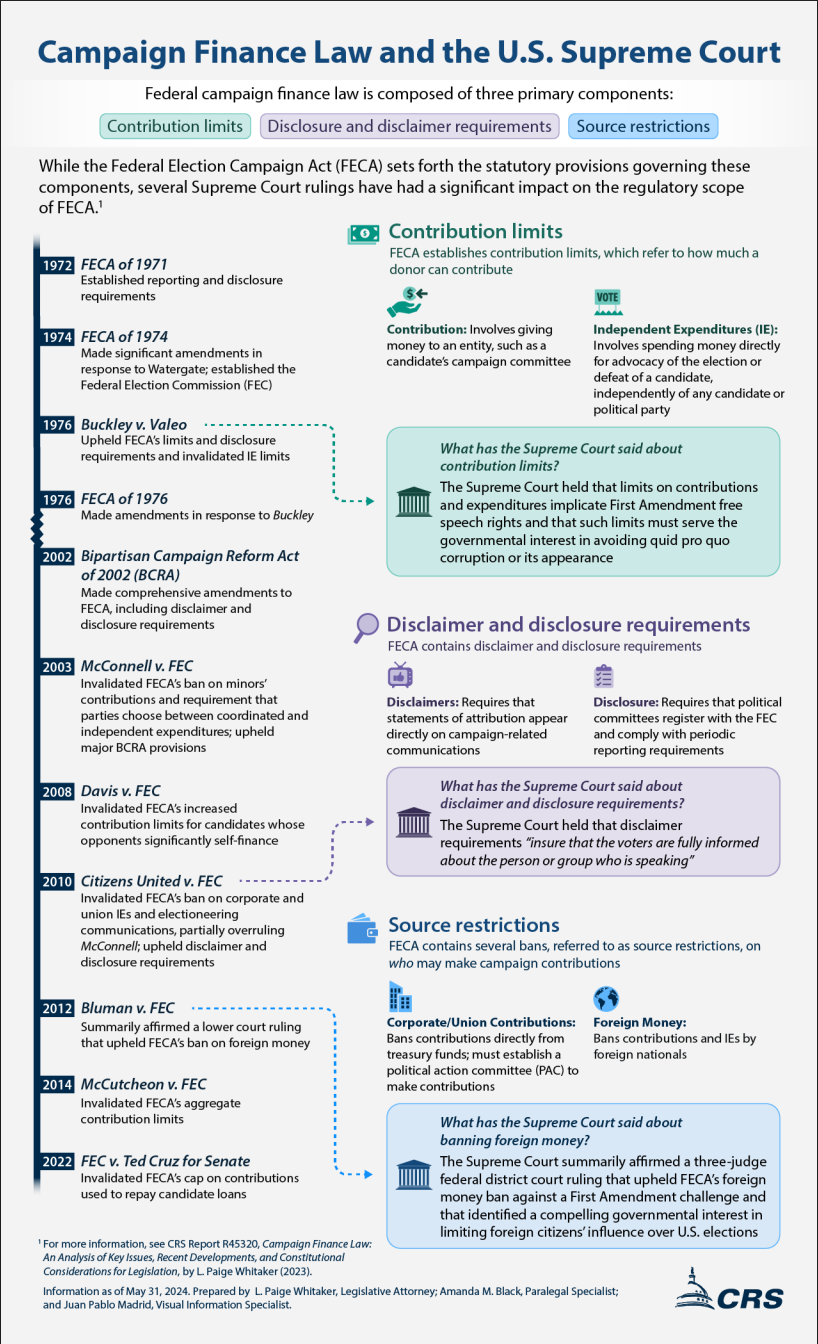
At CRS, I collaborate with policy analysts, subject-matter experts, and geospatial analysts to transform rigorous research into clear, authoritative visual products for the U.S. Congress.
My work includes infographics, data visualizations, and map-based storytelling designed to make complex legislative issues easier to navigate. Across each project, I balance accuracy, accessibility, and visual clarity—creating tools that help congressional clients engage with research and make informed decisions. I also represent the Visualization team in service-wide conversations, championing thoughtful uses of visual media across the Service.
Disclaimer: The work shown here was created as part of my role at the Congressional Research Service and is publicly available through Congress.gov. Images and links are included for portfolio purposes and direct viewers to the published research products.
The statements and commentary expressed are solely my own and do not represent those of the Congressional Research Service or the Library of Congress.
Infographics
Artificial Intelligence (AI) Taxonomy
This infographic is a collaboration between myself, Laurie Harris, Analyst in Science and Technology Policy, and Nora Wells, Analyst in Health Policy, at the Congressional Research Service. It makes sense of the evolving AI landscape by breaking down key terms and concepts and showing how they’re connected.
Taiwan’s Role in Global Semiconductor Supply Chains
This infographic is a collaborative effort between myself, Karen Sutter, Specialist in Asian Trade and Finance, and Cassandra Higgins, Geospatial Information Analyst, at the Congressional Research Service. It explores Taiwan's central role in semiconductor manufacturing and TSMC's leading position in the market.
North Asia: Key to Liquefied Natural Gas Markets
This infographic is a collaborative effort between myself, Michael Ratner, Specialist in Energy Policy, and Molly Cox, Geospatial Information Analyst, at the Congressional Research Service. It highlights the growth of North Asia’s liquefied natural gas (LNG) market as a consequence of Russia’s invasion of Ukraine.
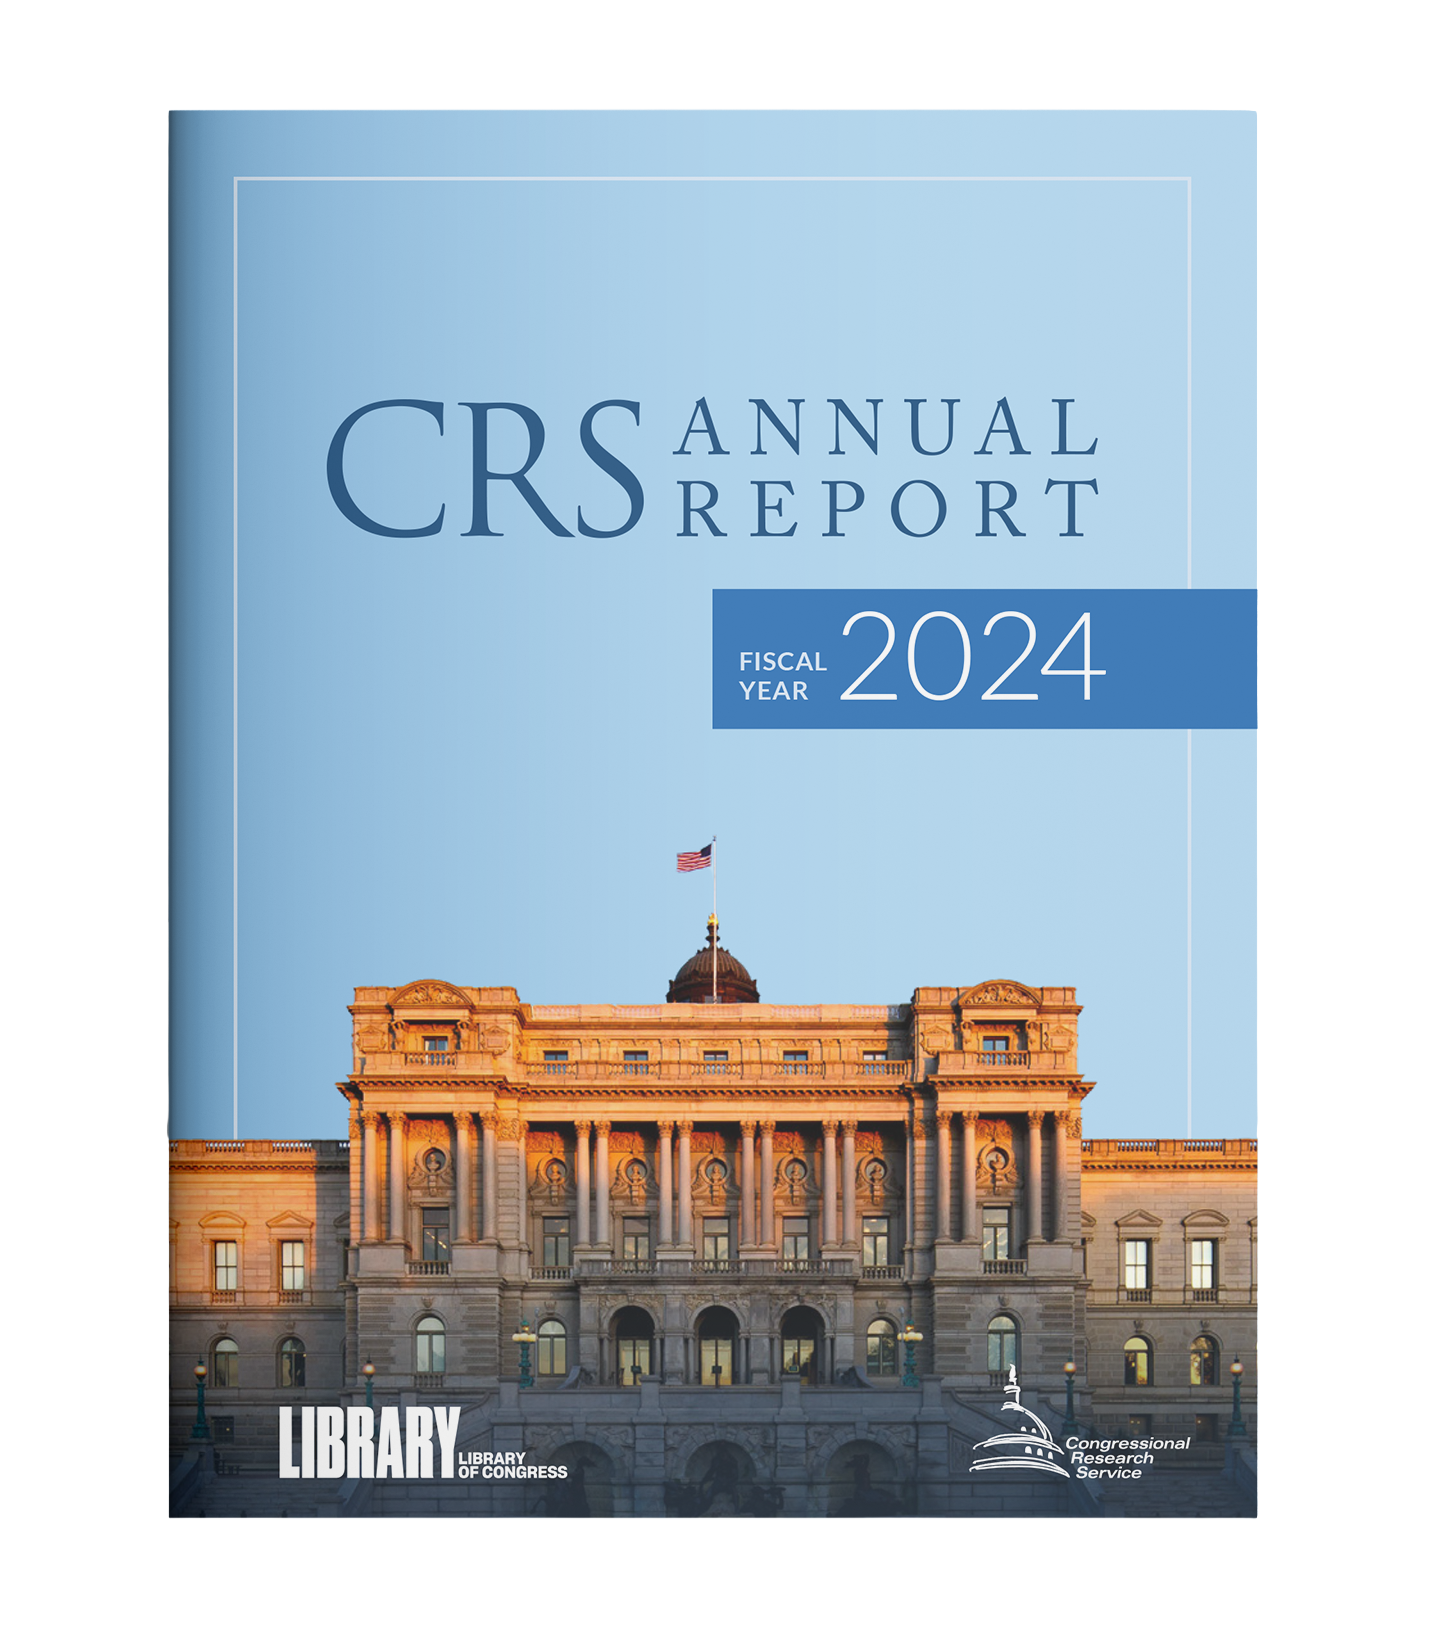
Annual Report
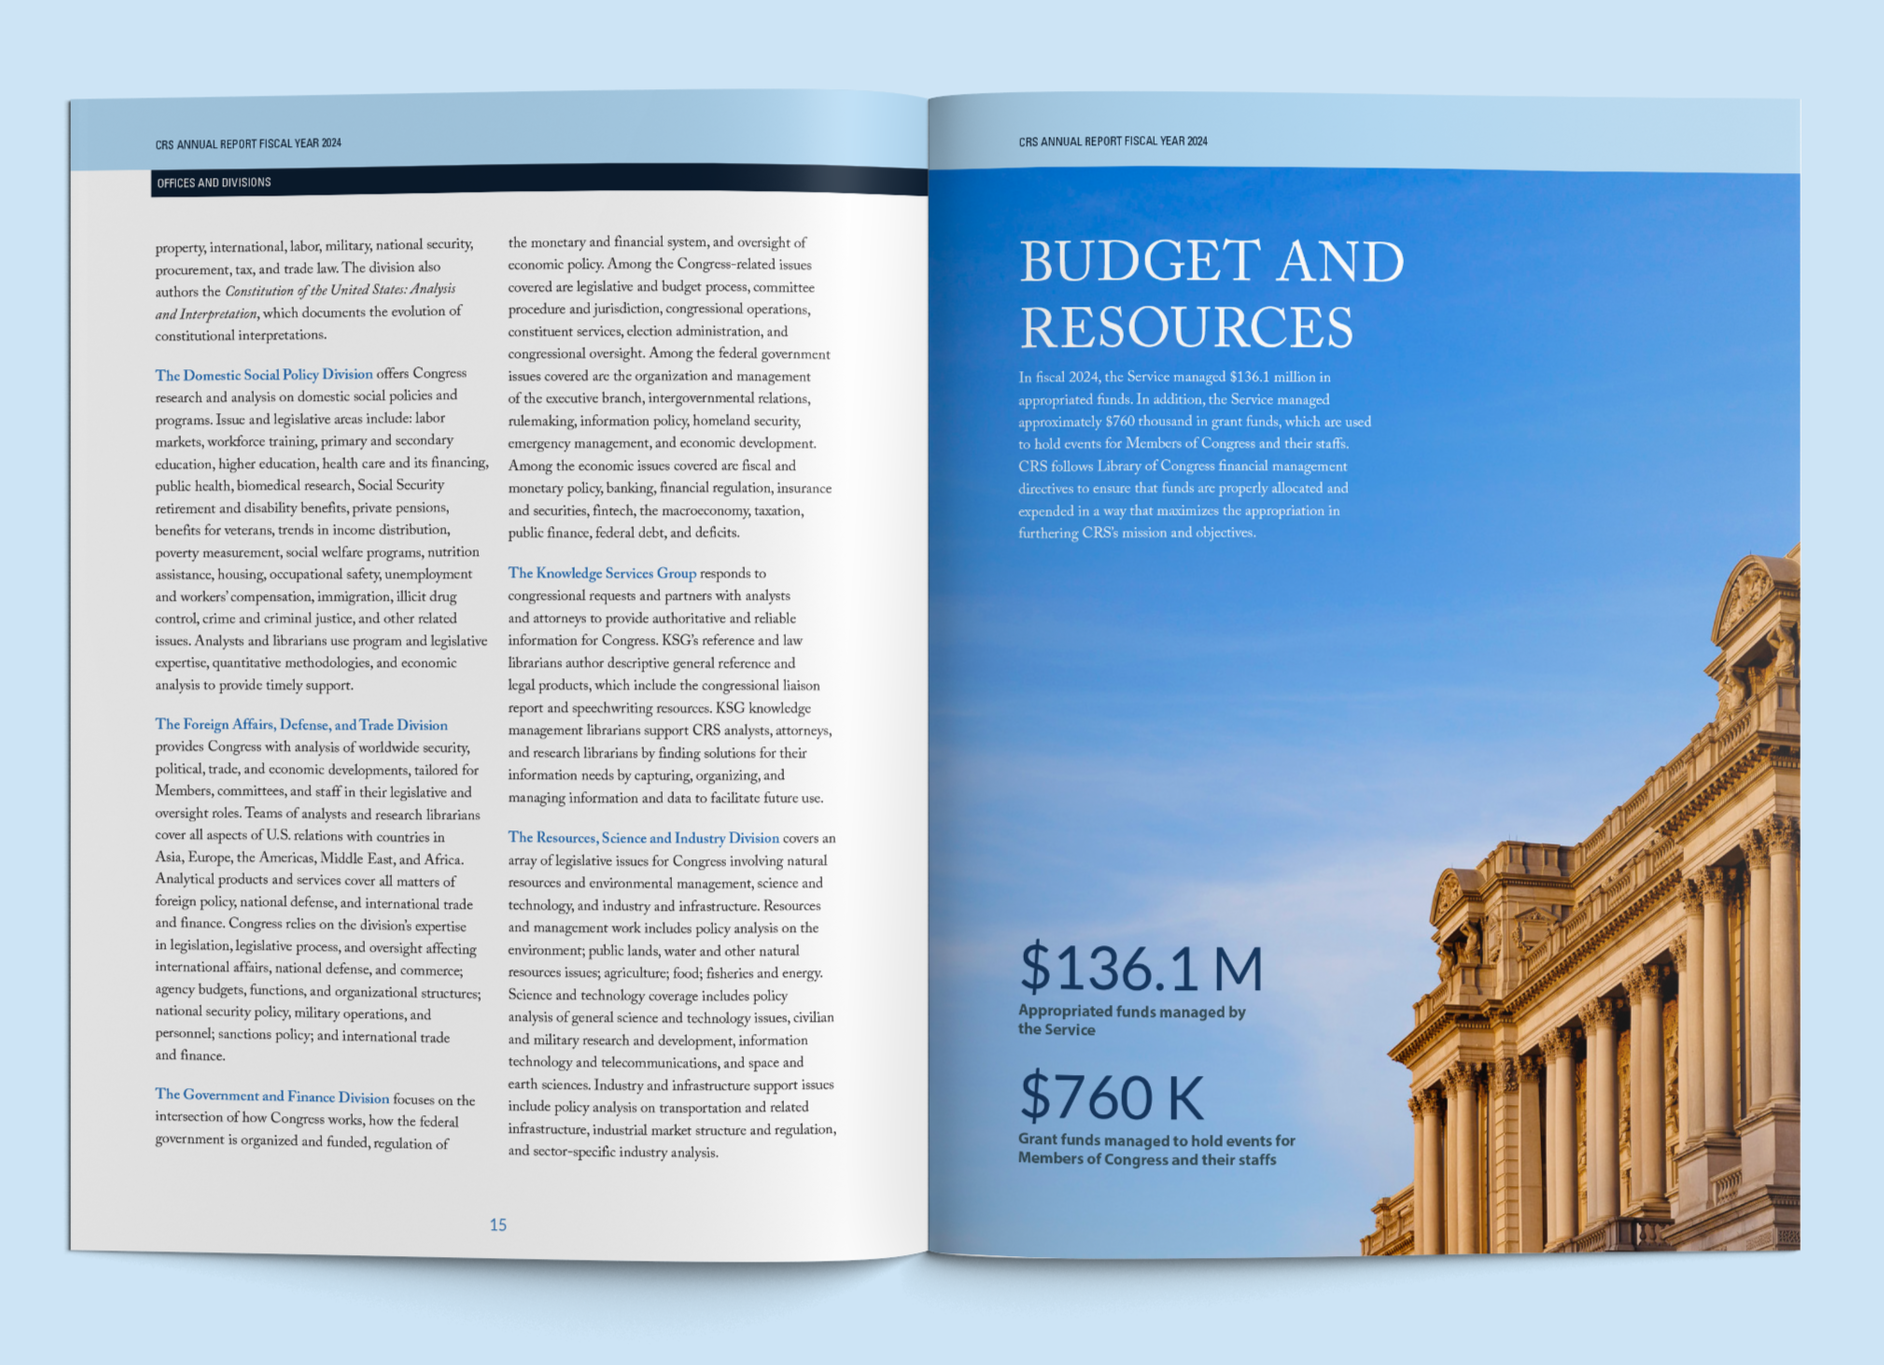
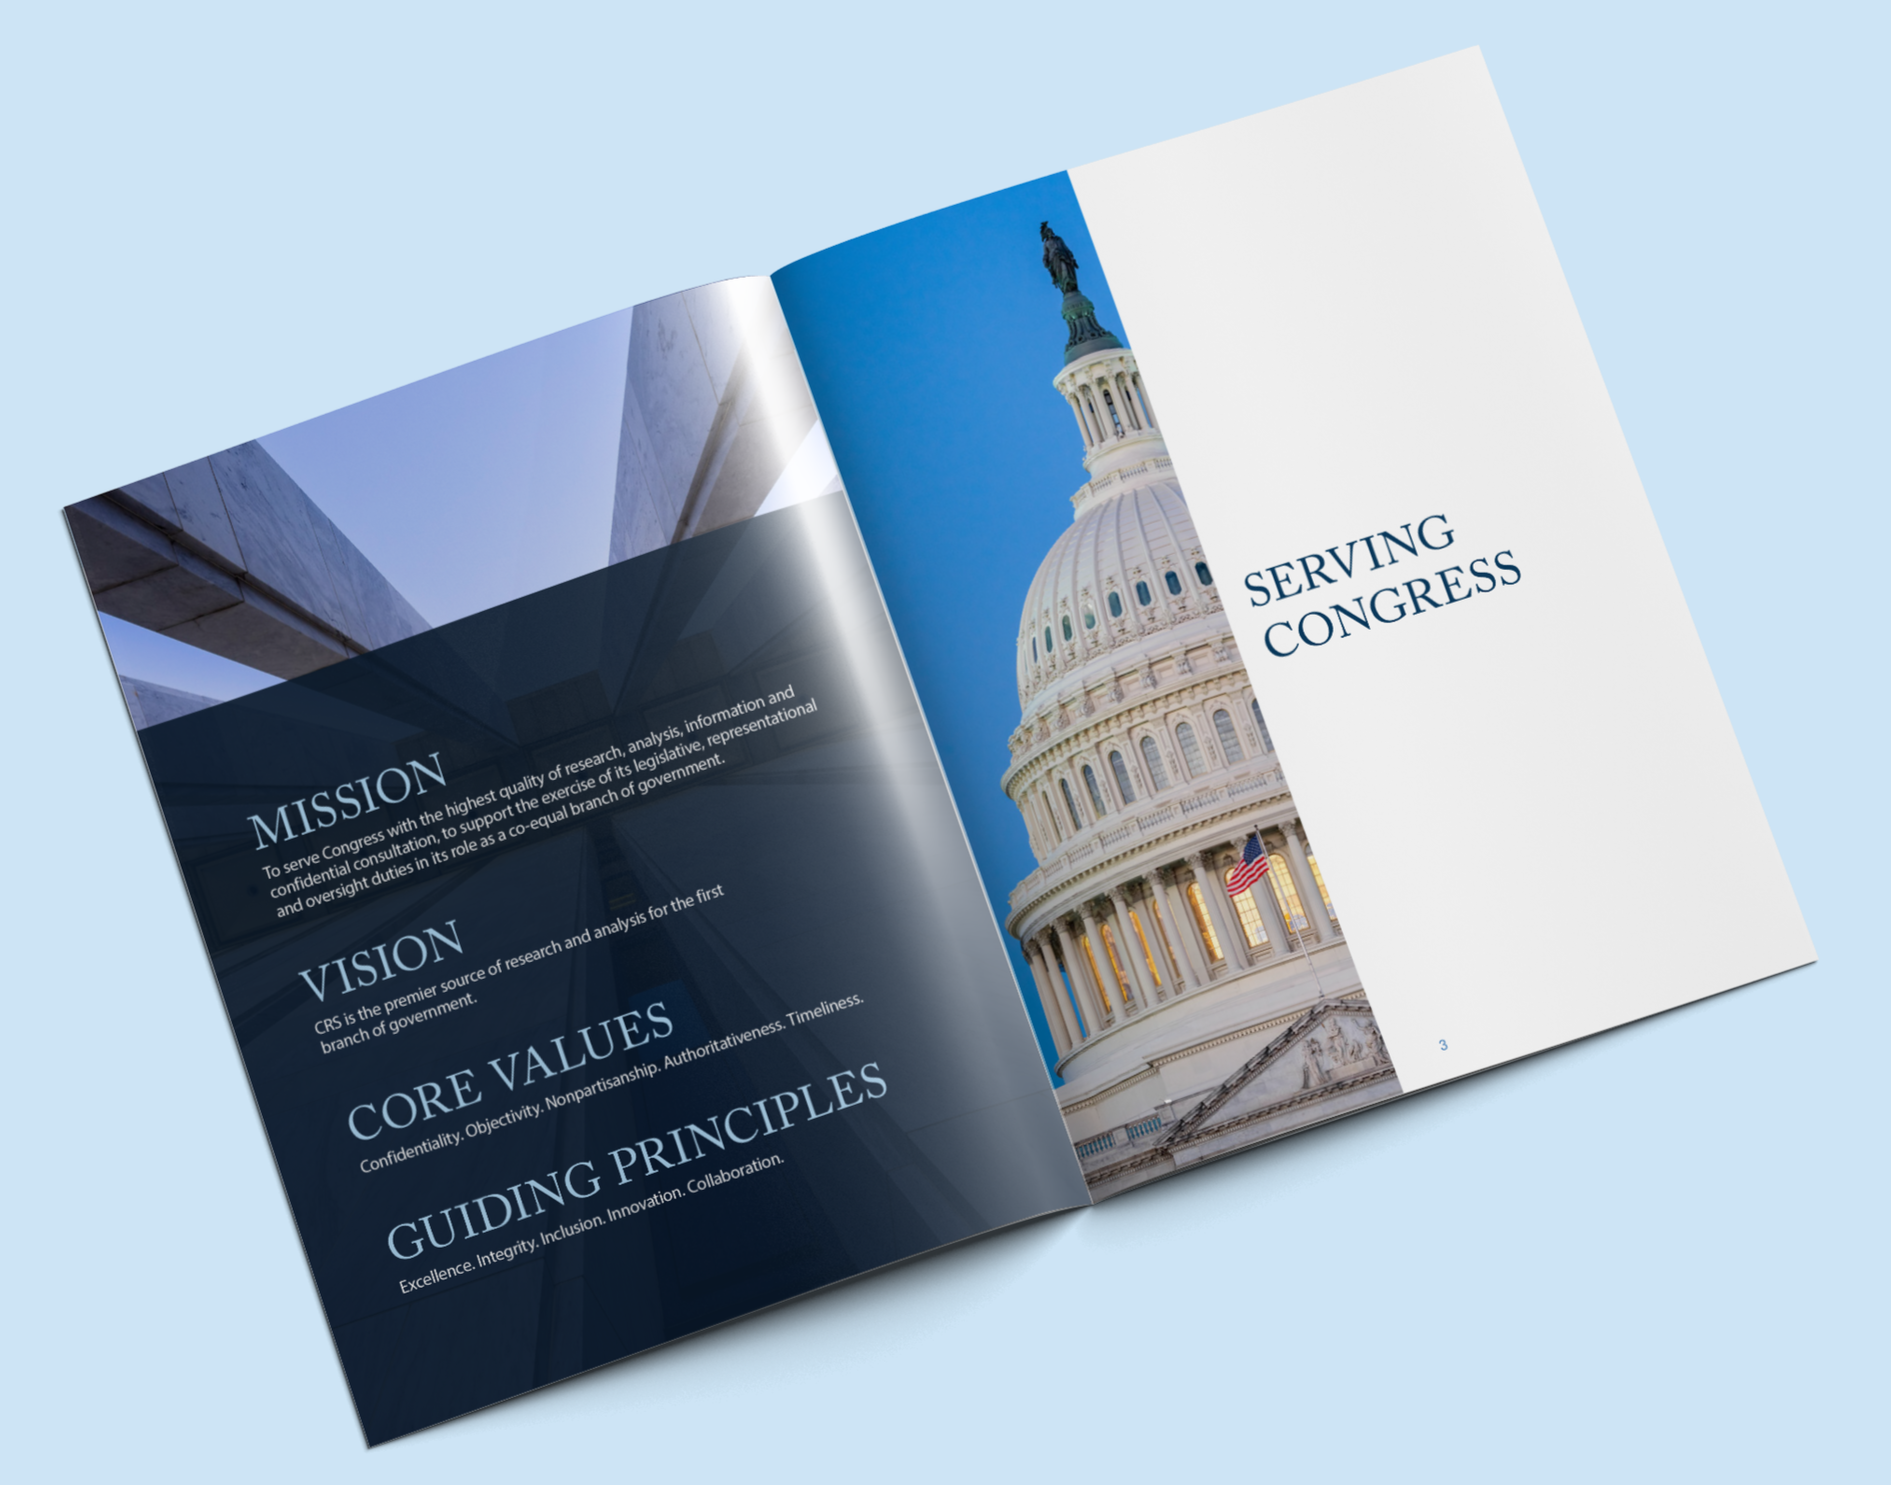
For the Fiscal Year 2024 Annual Report, I served as lead designer, collaborating with copywriters and partners across the agency to shape the publication’s content and visual direction. As the agency’s first annual report under new leadership, the project offered an opportunity to streamline the content and introduce a fresh, forward-looking visual direction.
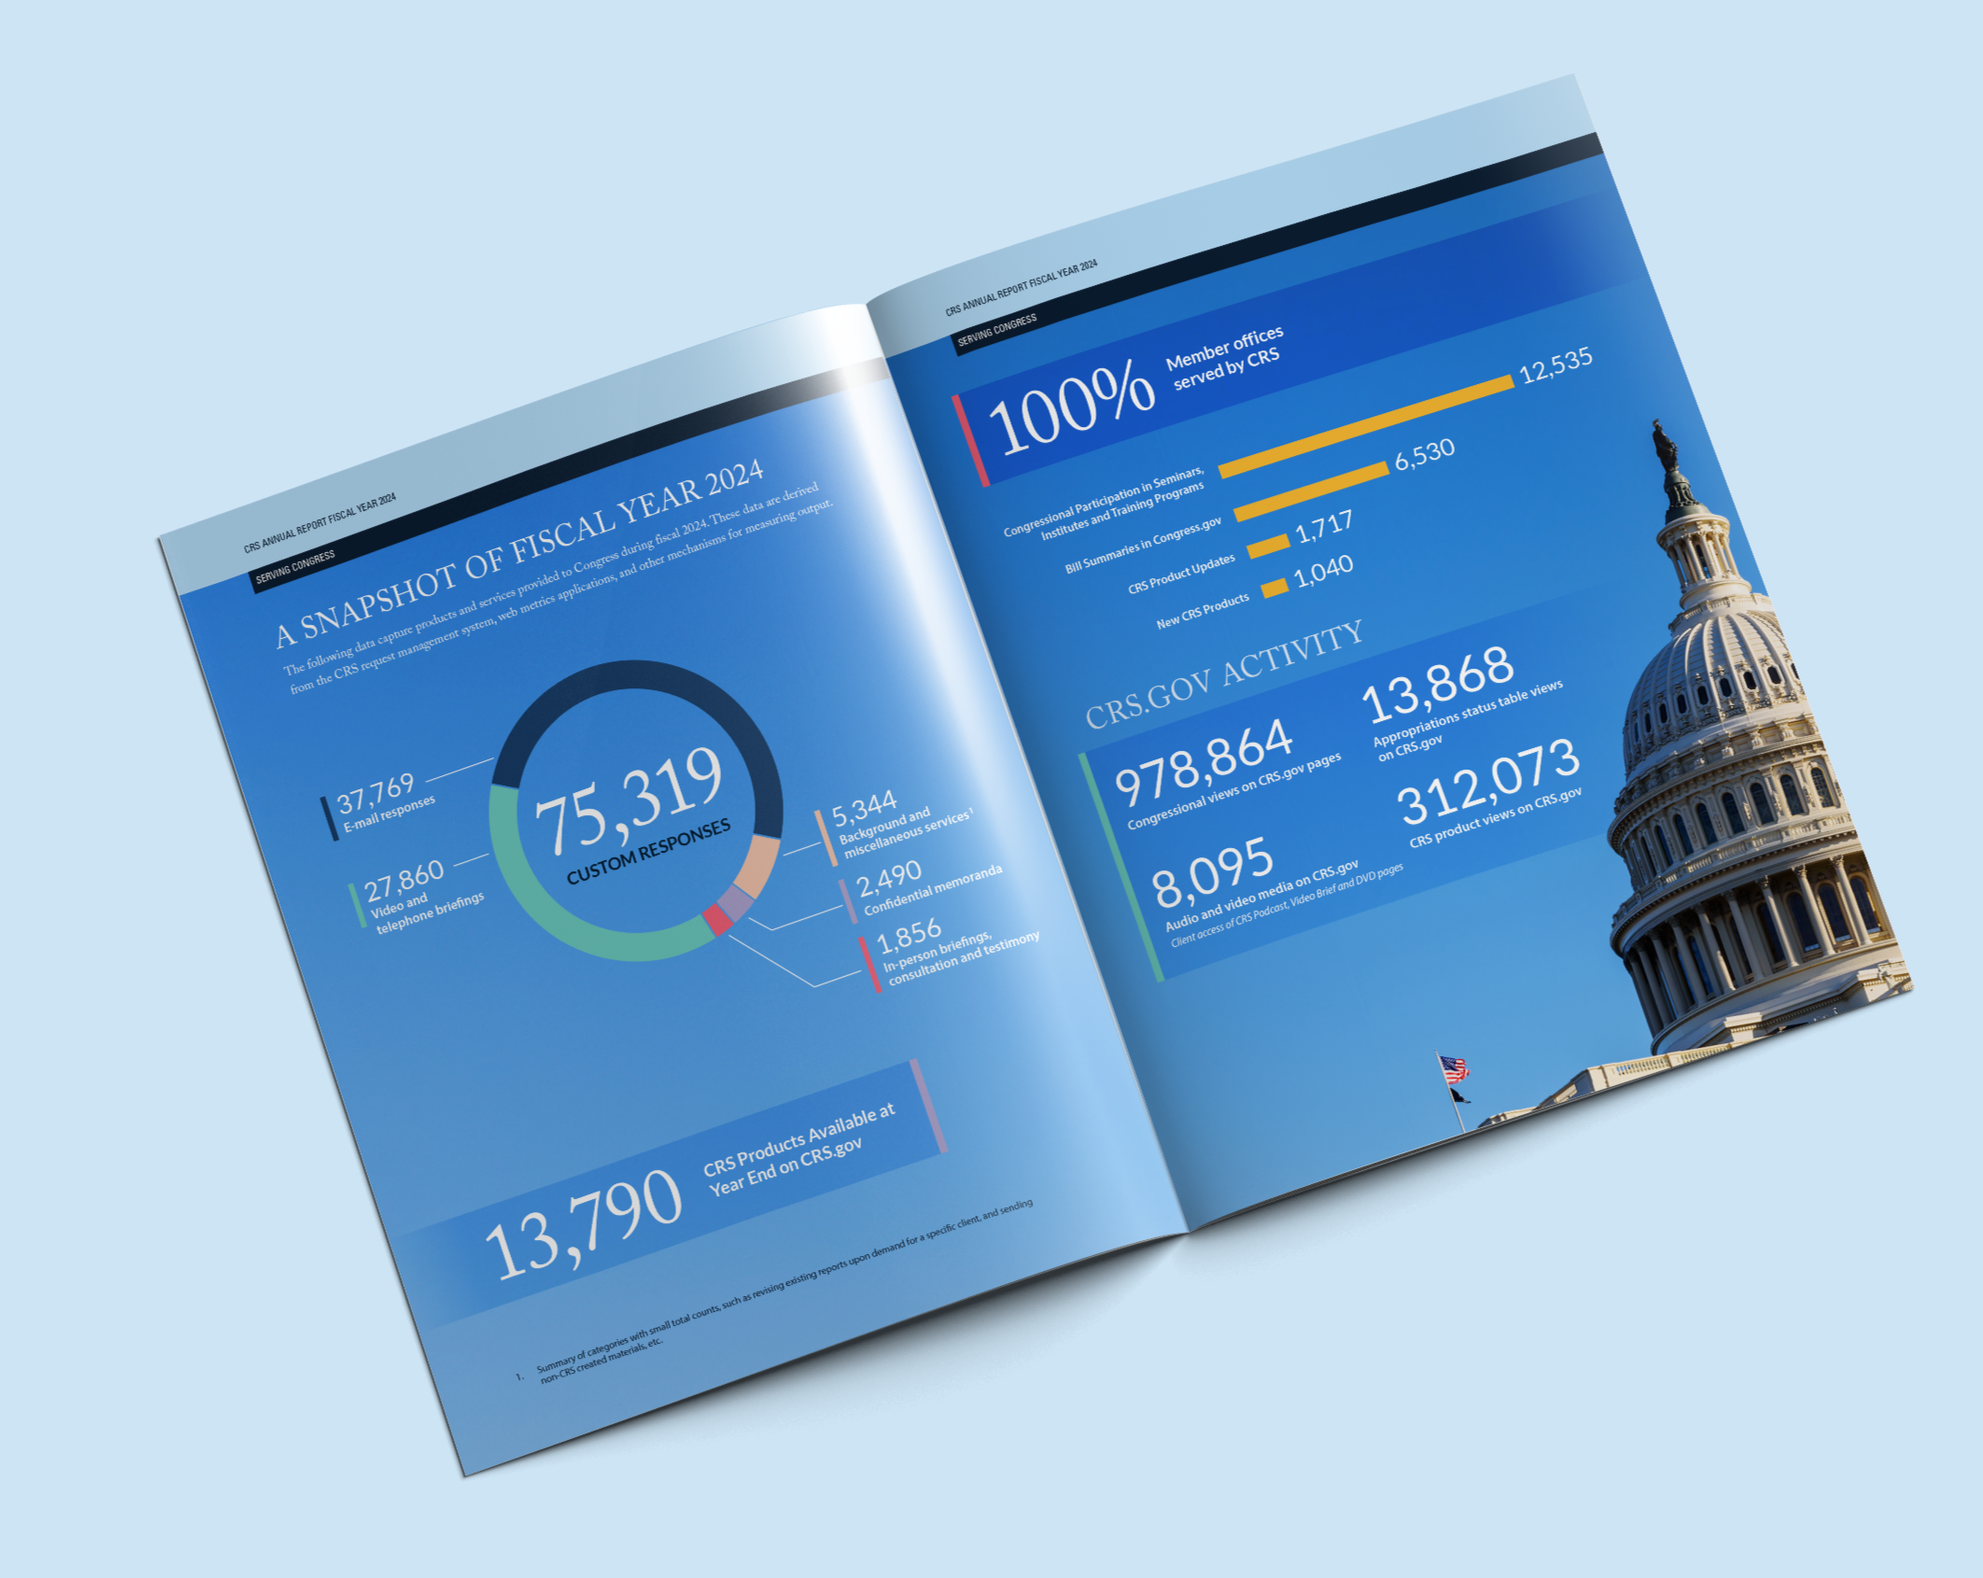
I selected photography from the Library’s extensive collections and paired it with generous white space and refined typography to create an airy, accessible reading experience. I also designed a data snapshot section that highlighted key metrics illustrating how CRS responded to congressional requests throughout the fiscal year.
The work shown was prepared as part of my employment at the Congressional Research Service (CRS). CRS Reports, as works of the United States Government, are not subject to copyright protection in the United States and may be reproduced and distributed in their entirety without permission from CRS. Some reports may include copyrighted images or material from third parties. Permission from the copyright holder may be required to copy or otherwise use that material.

The statements and commentary expressed are solely my own and do not represent those of the Congressional Research Service or the Library of Congress.